“That’s not the throughput I was expecting.”
I have heard that multiple times throughout my career, more so now that workloads are being transitioned into the cloud. In most cases it comes down to not understanding the relationship between IOPs (I/Os per second), I/O request size and throughput. Add to that the limitations imposed on cloud resources, not only the virtual machine, but the storage side as well and you have two potential bottlenecks.

For example, suppose an app has a requirement to sustain 200 MB/sec in order to meet SLA and app response times. On Azure, you decide to go with the DS3_v2 VM size. Storage throughput for this VM is 192MB/s. A single 8 TiB E60 disk is used meeting the capacity requirements as well as throughput at 400MiB/sec.
Both selections appear, on the surface, to provide more throughput than 200 MiB/s required:
- VM provides 192MiB/s
- E60 provides 400MiB/s
But when the app gets fired up and loaded with real user workloads the users start screaming because it’s too slow. What went wrong?
Looking deeper there is one critical parameter that needed to be considered. The I/O request size. In this case the I/Os being made by the app are 64 KiB.
In addition to throughput limits there are also separate IOPs limitations set by Azure for the VM and disks. Here is where the relationship between IOPs, request size and throughput come into play:
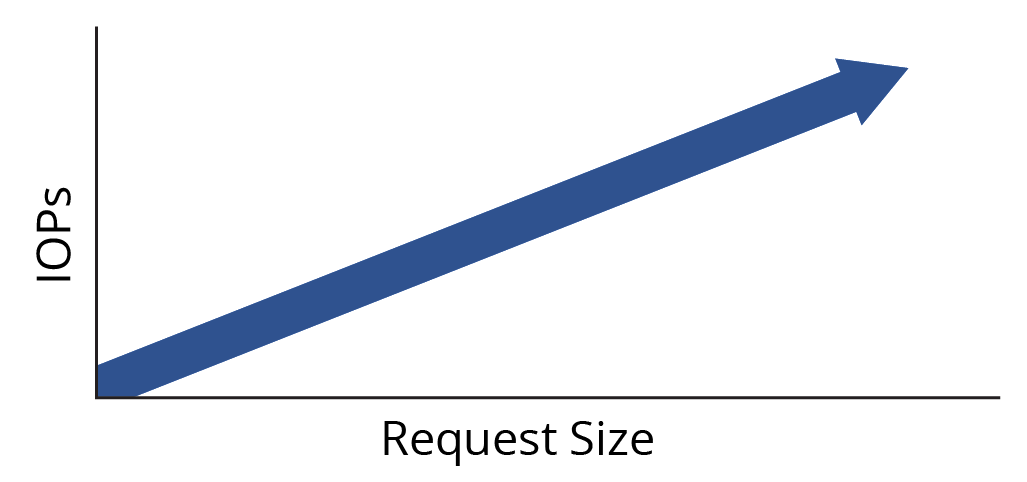
IOPs X Request Size = Throughput
When we apply the VM storage IOPs limit of 12,800 and the request size of 64K we get:
12,800 IOPs X 64K Request Size = 819200 KiB/s of Throughput
or 800 MiB/s
We do not have a bottleneck with the VM limits.
When we apply the disk IOPs limit of 2,000 IOPs per disk and the 64K request size to the formula we get:
2,000 IOPs X 64KiB = 128,000 KiB/s
or 125 MiB/s
Clearly this is the throughput bottleneck and is what is limiting the application from reaching its performance target and meeting the SLA requirements.
In order to remove the bottleneck additional disk devices should be combined using RAID to take advantage of the aggregate performance in both IOPs and throughput.
In order to do this, we first need to determine the IOPs we need to achieve using 64K request sizes.
IOPs = Throughput / Request Size
200 MiB/s = 204,800,320 KiB/s
204,800 KiB/s / 64KiB = 3,200 IOPs
In this scenario the geometry of the storage would be better configured using 8 X 1TiB E30 disks, which delivers more throughput at the desired block size. Each disk provides 60 MiB/s throughput for a combined 480 MiB/s (8 X 60MiB/s)
Each disk provides 500 IOPs for an aggregate of 4,000 IOPs (8 X 500). At a combined cap of 4,000 iops and a request size of 64KiB this would achieve 250MiB/s.
64KiB X 4,000 = 256000 KiB/s
or 250 MiB/s
This configuration effectively removes the bottleneck. The performance needs, throughput AND IOPs, of the app are now all satisfied with additional headroom for future growth, variations in cloud behavior, etc.
Conclusions
It’s not enough to simply look at disk and VM throughput limits to deliver the expected performance to meet SLA’s. One must consider the actual application workload I/O request sizes combined with available IOPs to understand the real throughput picture as seen in the chart below.
| Available IOPs Limit | Request size | Max Throughput |
| 2000 | 4 KiB | 8000 KiB/s (7.8 MiB/s) |
| 2000 | 32 KiB | 64,000 KiB/s (62.5 MiB/s) |
| 2000 | 64 KiB | 128,000 KiB/s (125 MiB/s) |
| 2000 | 128 KiB | 256,000 KiB/s (250 MiB/s) |
Use the simple formulas and process above and it will get your storage performance into the ballpark with less experimentation, wasted time and deliver the results you seek.


